Gunnison Copper Project
| COMMODITY: | Copper |
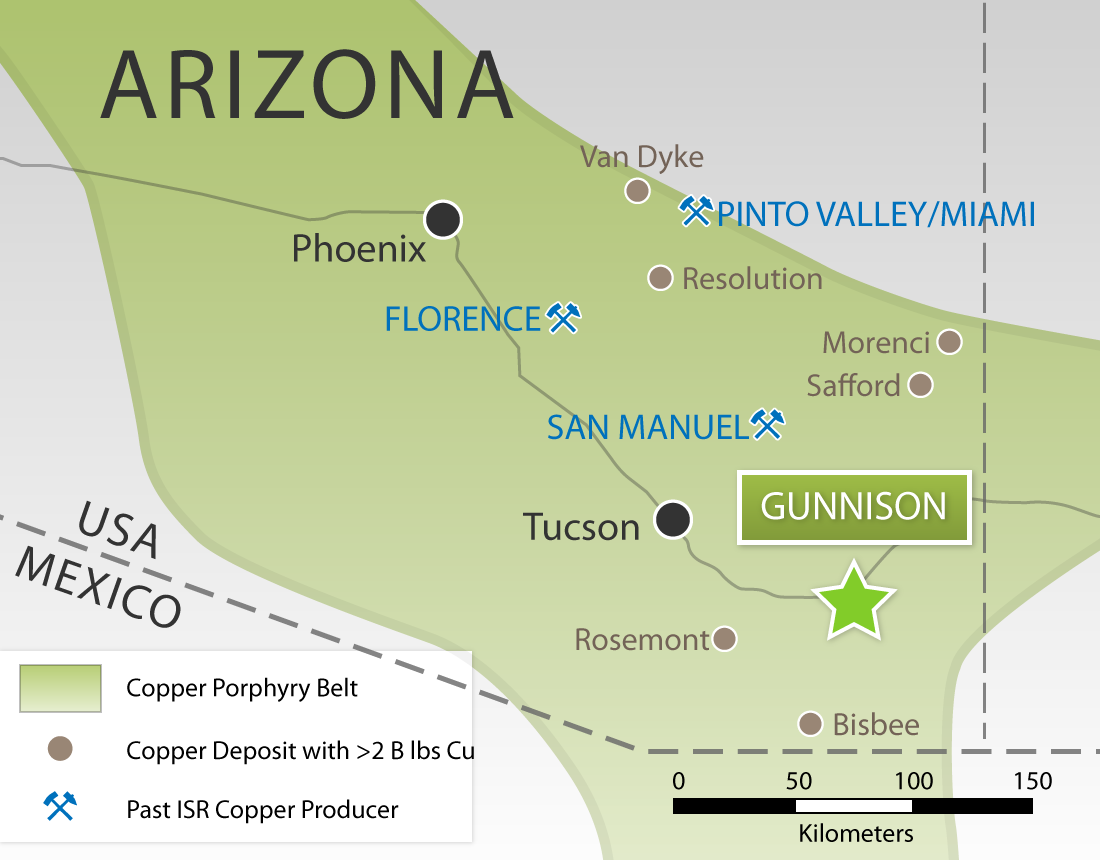
| LOCATION: | Arizona, USA |
| SIZE: | 9,560 Acres |
| OWNERSHIP: | 100% |
Industry-Leading Economics
- US$1,167 NPV & 37.5% IRR (After-tax, LOM US$3.75 Cu price, 7.5% discount rate)
- Direct Operating Costs: $0.945/lb & Total Cash Costs: $1.23/lb
- All-In Cost (LOM capital costs plus operating costs) of $1.73/lb
- Pre-production capital costs of $47.6 million
- 24 years of mine life
- Starts at 25M lbs per year & expands to 125M lbs per year
- 2.15 billion pounds of pure copper cathode to be produced
*Based on February 2023 PFS
Additional information about the GUNNISON PROJECT PREFEASIBILITY STUDY can be found in the technical report filed on SEDAR at www.sedar.com entitled
Reserves
North Star Mineral Reserves
| Short Tons (millions) | Total Copper % | Pounds of Cu (billions) | |
| Probable | 782 | 0.29 | 4.5 |
North Star Mineral Resources (as of July 7, 2015)
| Short Tons (millions) | Total Copper % | Pounds of Cu (billions) | |
| Measured | 199 | 0.36 | 1.43 |
| Indicated | 674 | 0.27 | 3.57 |
| Measured + Indicated | 873 | 0.29 | 4.99 |
| Inferred | 187 | 0.17 | 0.63 |
The Mineral Resources (0.05% cut-off) are inclusive of Mineral Reserves (0.05% cut-off). The oxide and transition portion of the Mineral Reserve has the potential to be mined using in-situ recovery methods with an estimated total copper recovery of 48%.
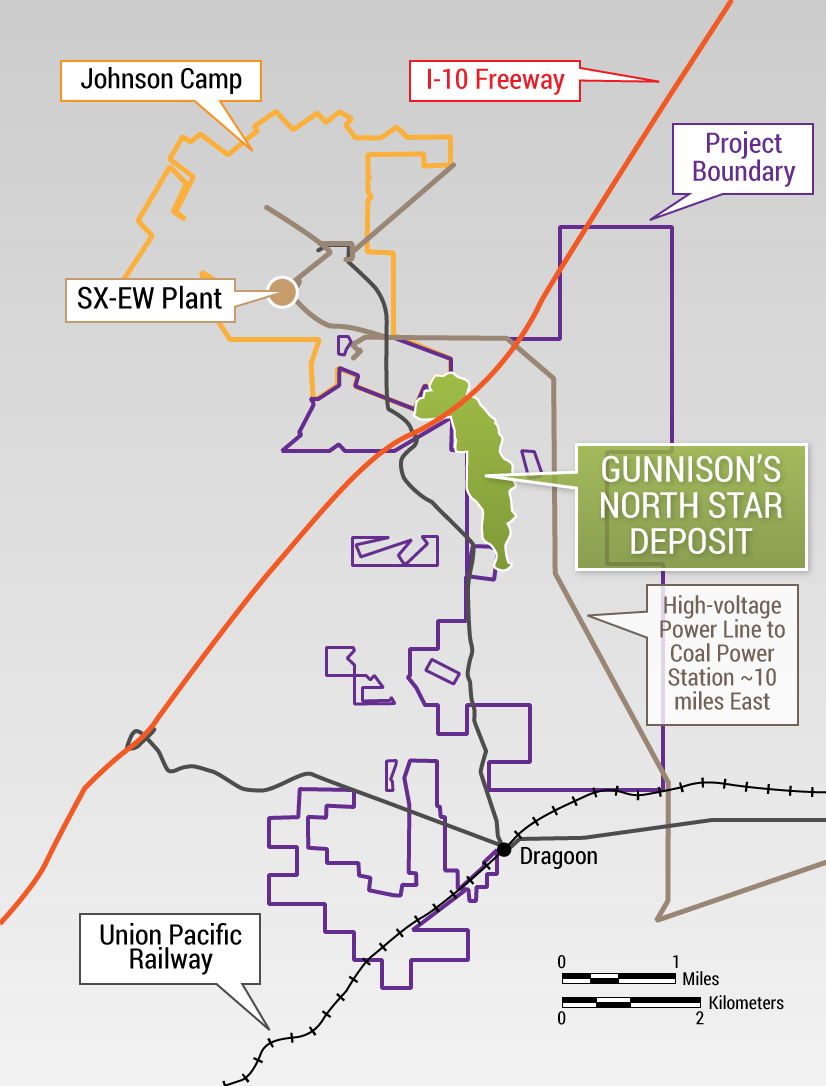
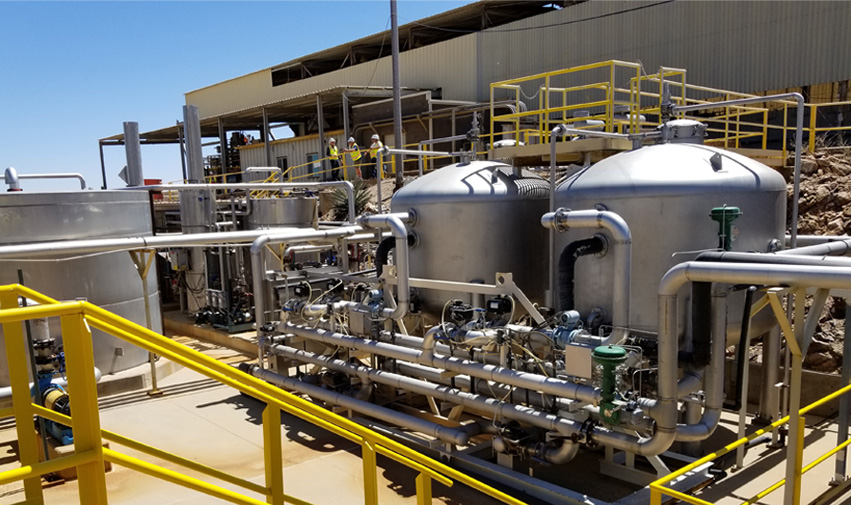
Johnson Camp Mine (JCM)
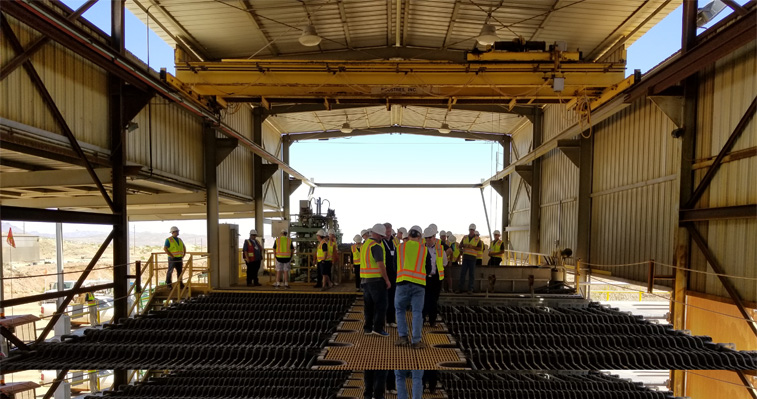
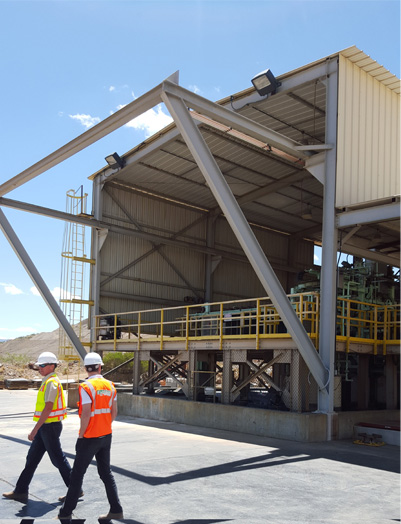
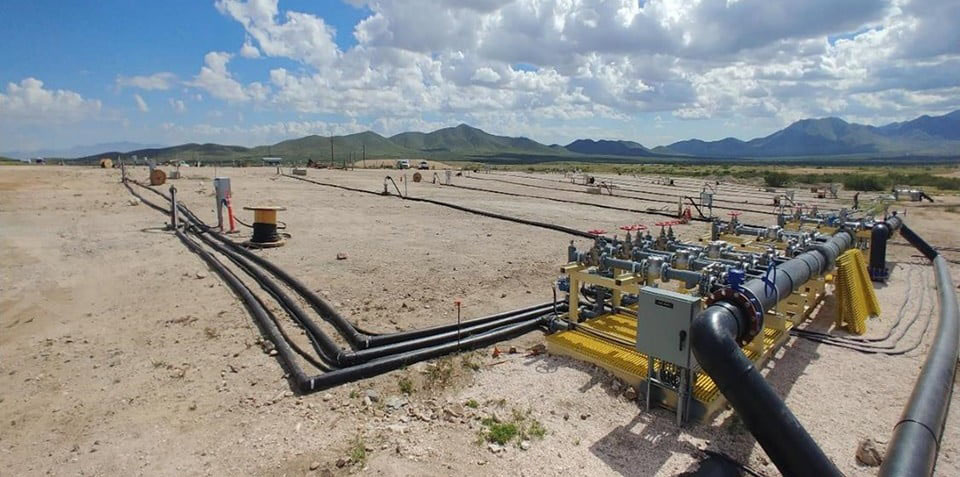
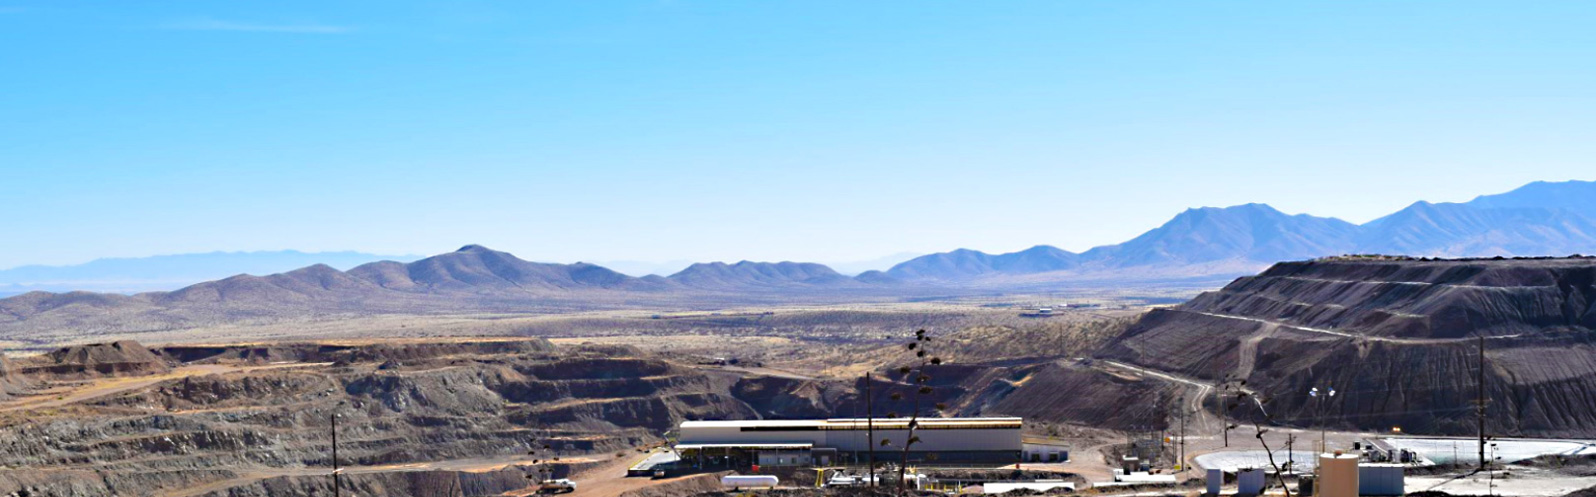
The 100% owned Johnson Camp Mine is located just over one mile from the wellfield; copper-bearing solution will be processed here through the SX-EW facility into 99.999% pure copper cathode. Purchased in 2015 for only US$8.4 million, JCM saves Excelsior millions of dollars in capex.
First Copper Production
First Copper Production
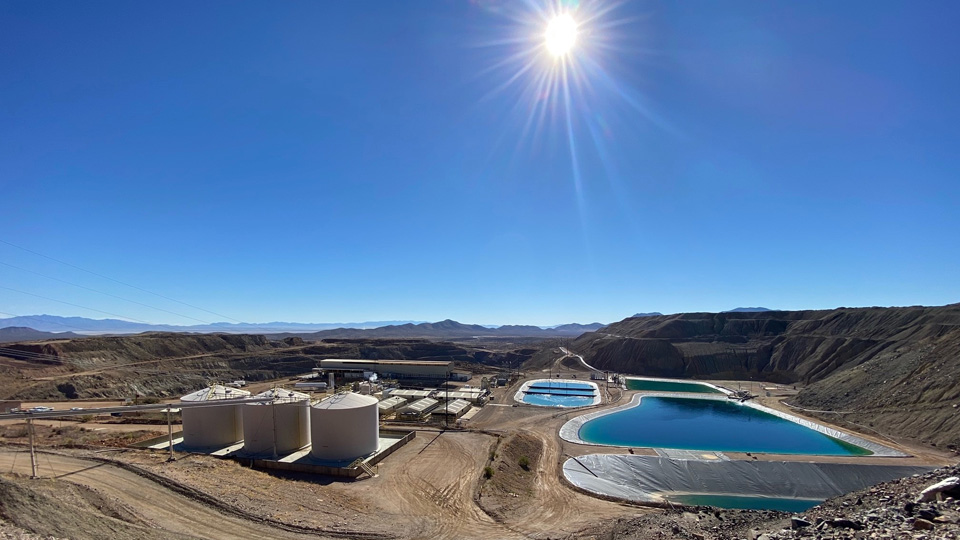
Environmentally Friendly Copper Extraction
- Low water consumption (most groundwater is recycled)
- No groundwater contamination; no acid mine drainage
- Excellent mine closure plan
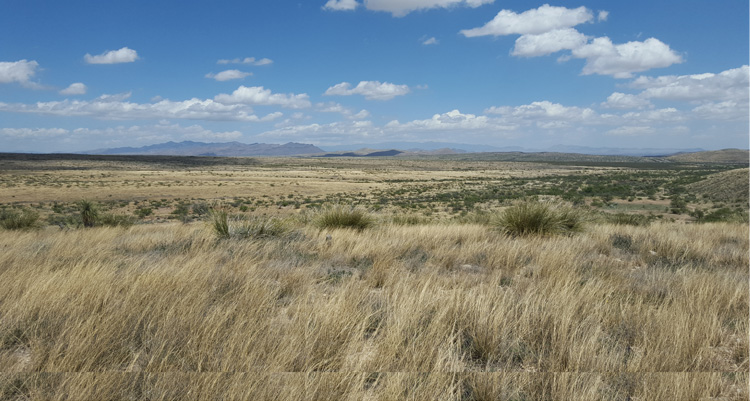
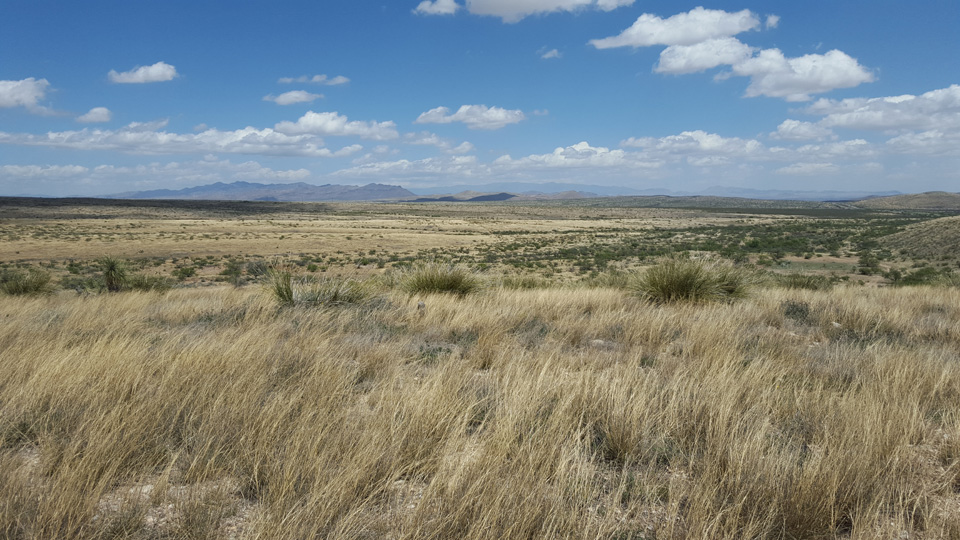
- Remote location
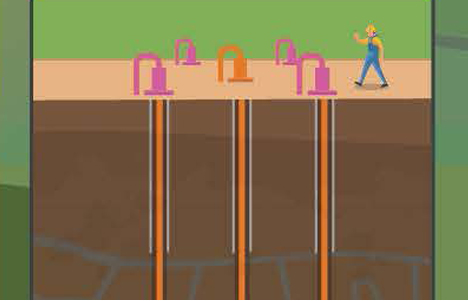
Well Stimulation
Wellfield stimulation has the potential to fundamentally change the performance of Excelsior’s in-situ wellfield.